Gantries
2022
A map-centric approach to explore Singapore’s Electronic Road Pricing (ERP) rates.
Includes animations that aid in the discovery of gantry rates. Relies on automated GitHub Actions pipelines to periodically fetch, process and update the custom Mapbox style.
Built using TypeScript, React, Mapbox, Playwright.
ExploreMap of all ERP gantries and current rates
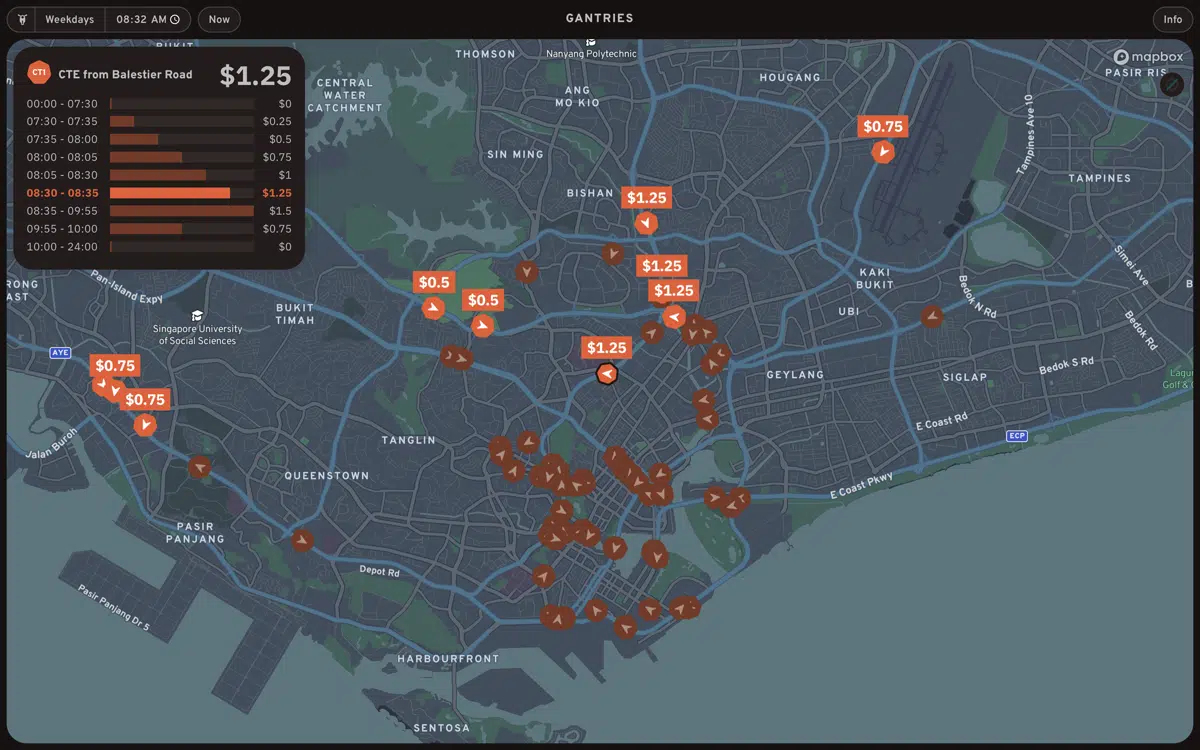
Animation to hint of a swipe gesture
Swipe gesture to see all rates
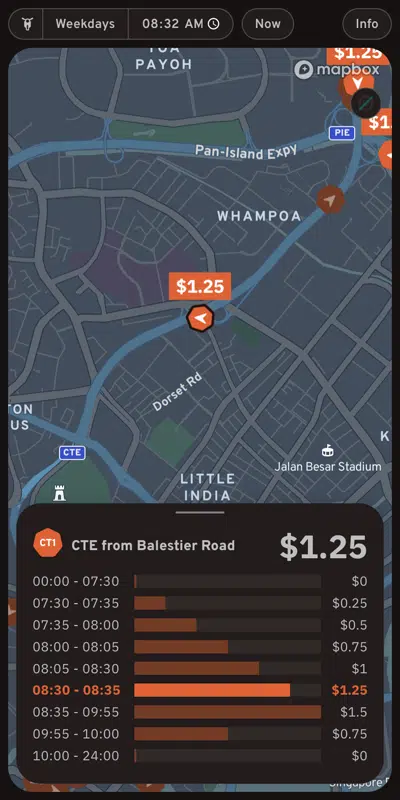
Collapsed view showing upcoming rates
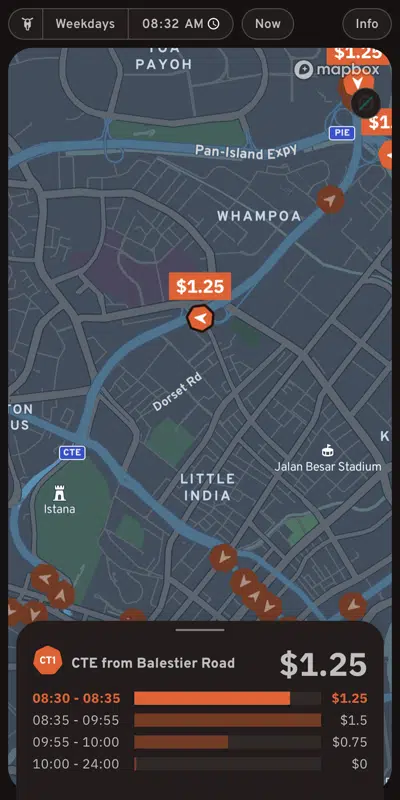
Expanded view showing all rates
See rates by vehicle type
See rates by time
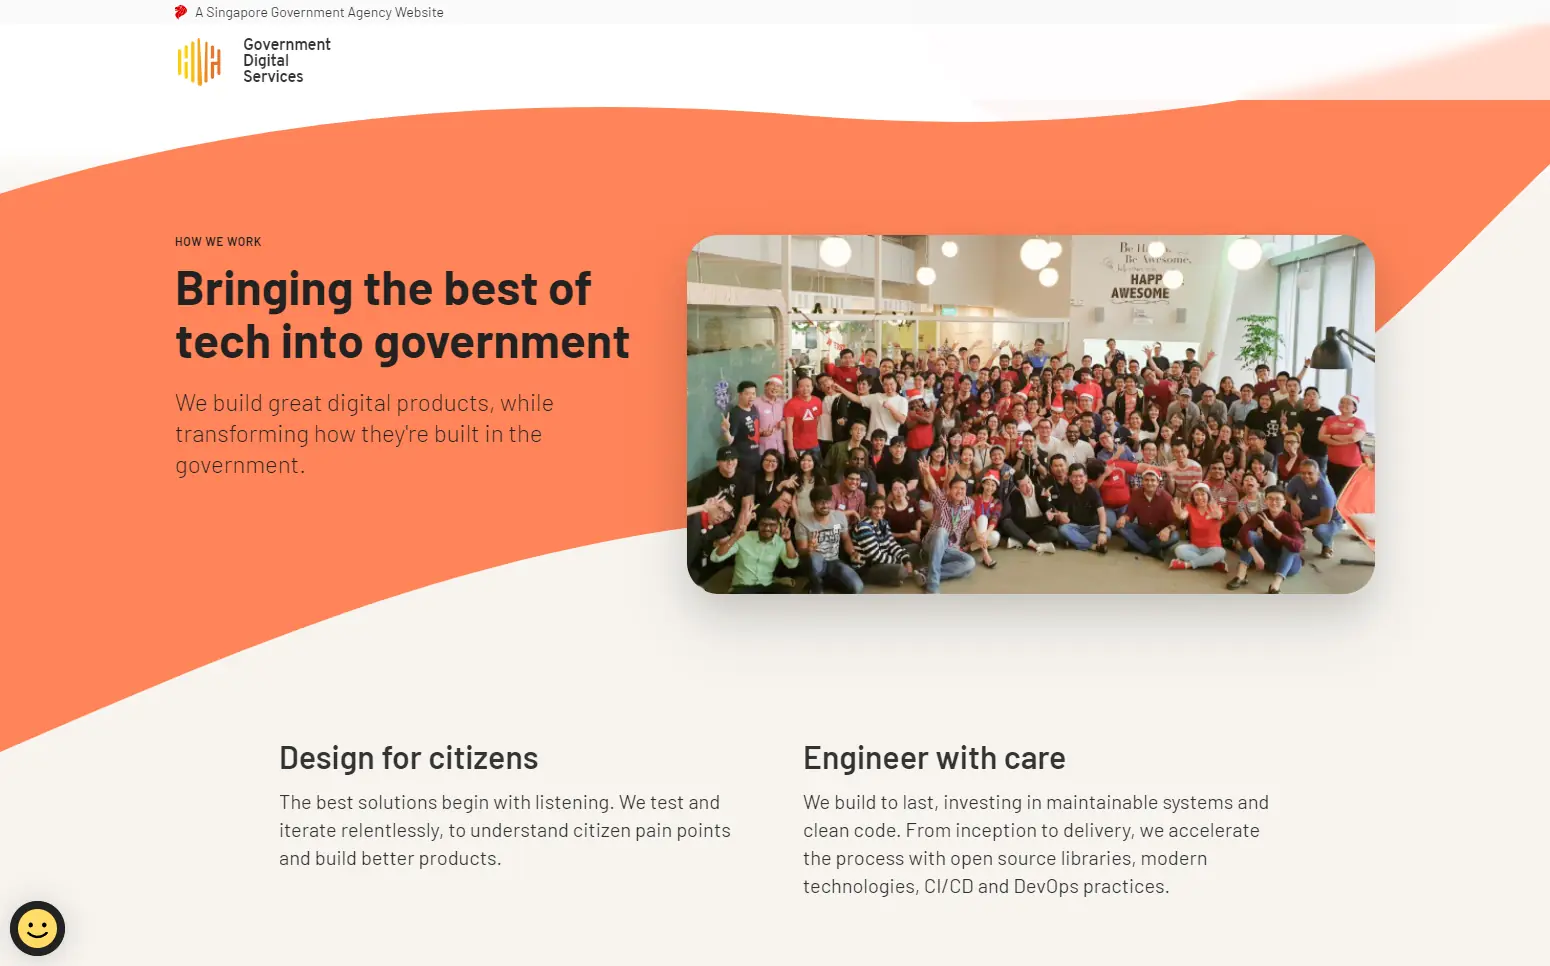
GDS Landing Page
2020
A landing page for Singapore’s Government Digital Services.
Built using TypeScript, Gatsby, styled-components.
ExploreAnimated hero banner (Desktop)
Animated hero banner (Mobile)
Animated 'What we do' section (Mobile)
Animated 'What we do' section (Desktop)
'How we work' section
'Benefits' section

'Blog' section
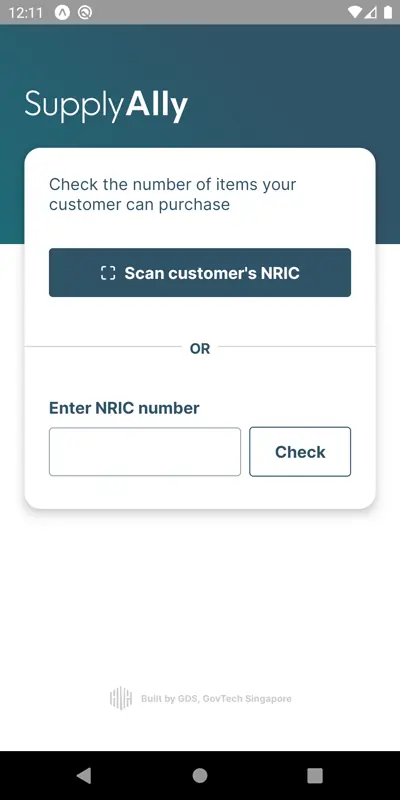
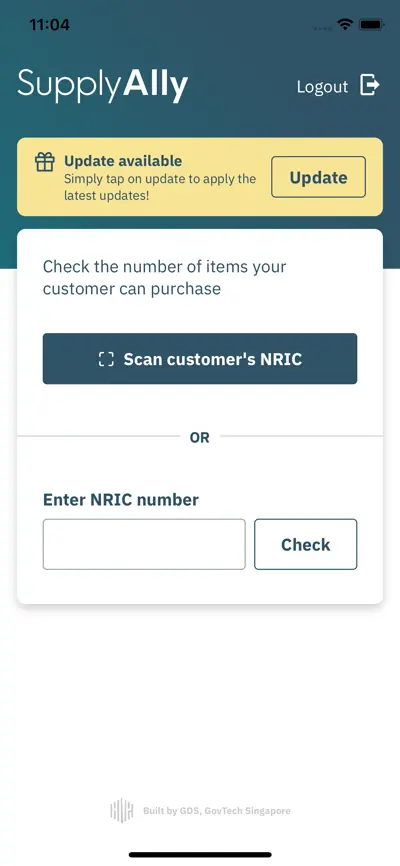
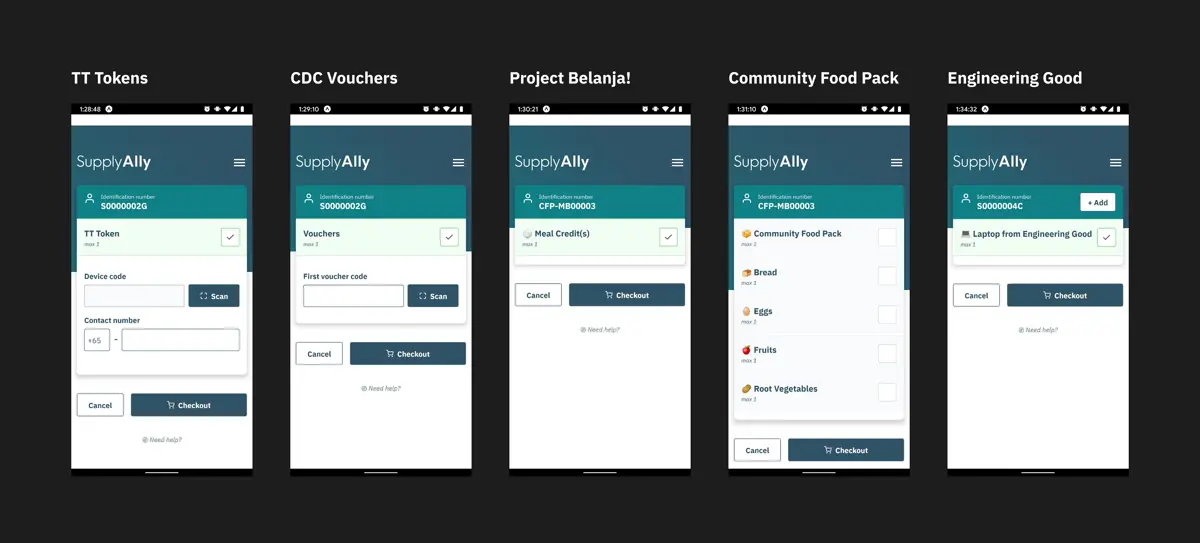
SupplyAlly
2020 - 2022
Service that tracks the distribution of items to ensure each resident gets their fair share.
Primarily used for COVID-19 initiatives such as the distribution of reusable masks, contact tracing tokens, antigen rapid test kits and tourism credits.
Built using TypeScript, React Native, Expo, Node.js, Serverless Framework, AWS (API Gateway, Lambda, DynamoDB).
ExploreLogin via QR codes

Scan ID (type of ID is configurable)
Over-the-air updates via Expo
Quota of items to be distributed
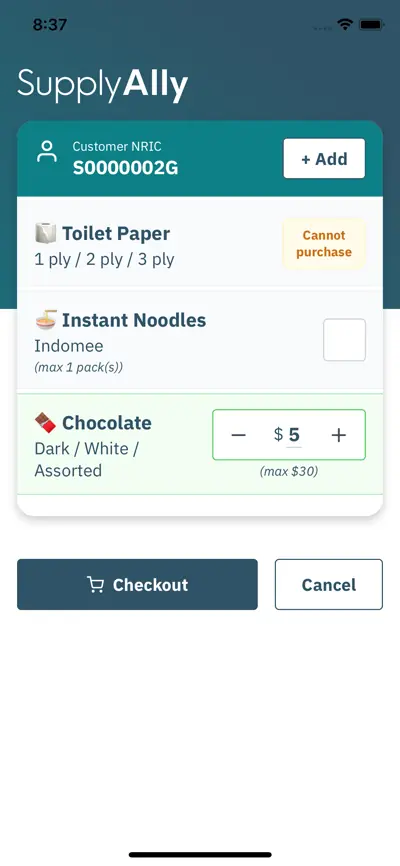
Toggles with acceleration and rounding
Configurable items via AWS Parameter Store
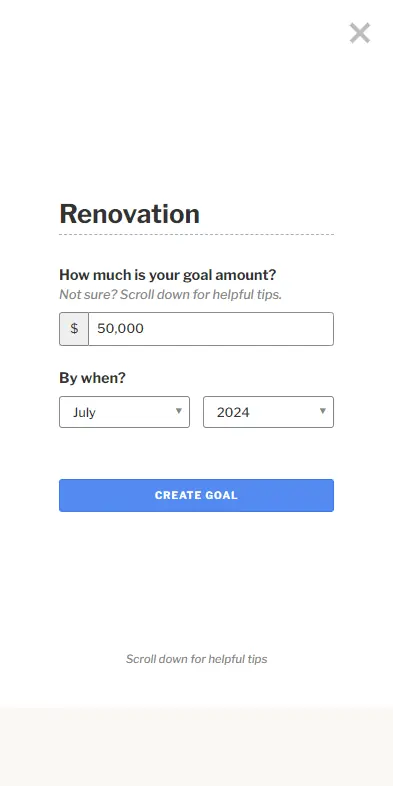
mapyourgoals
2019
A calculator that helps you understand how much you should save every month to reach your financial goals.
Move and resize your goals through the interactive D3.js chart to see the effects and recommendations.
Built using React, Redux, D3.js.
ExploreInteractive chart to find out if you're saving enough for your goals
Home page

Enter current savings

Select goal category

Enter goal details (amount and date)
See recommendations on how to meet your goals
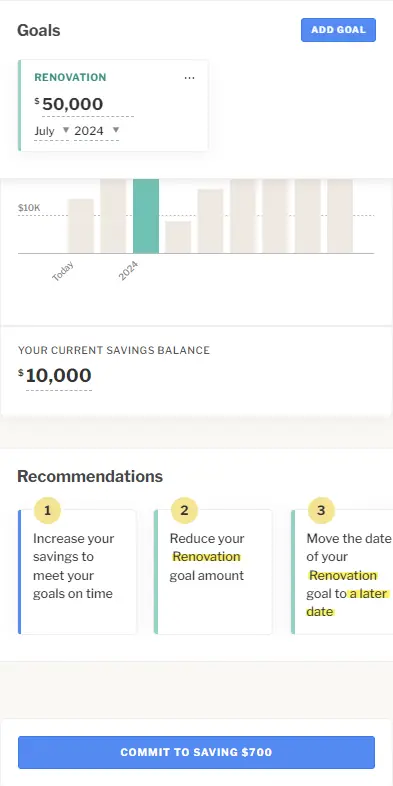
Commit to saving the specified amount

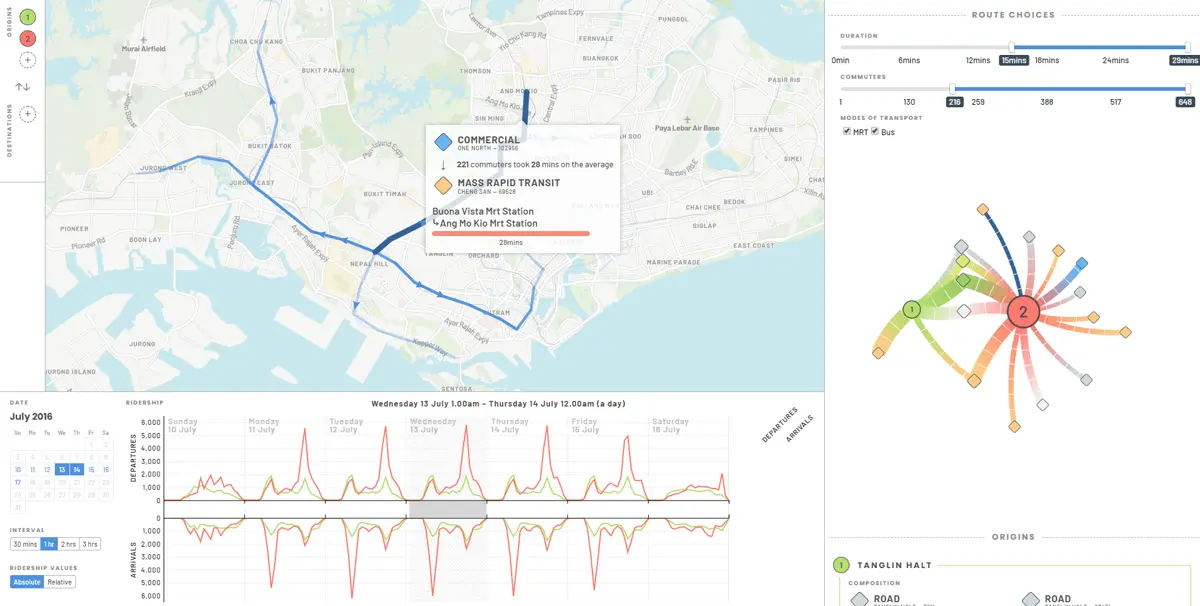
Commute
Late 2017 - Mid 2018
An interactive visualisation tool to explore spatio-temporal transport datasets.
Created a custom force-directed chart that represents route choices and a time manager that makes filtering and navigating the temporal aspects of the dataset easy.
Built using React, Redux, D3.js, Mapbox, Koa, PostGIS.
ExploreDashboard screen
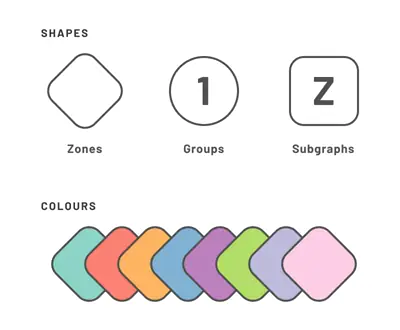
Basic shapes and colours used
Tooltips
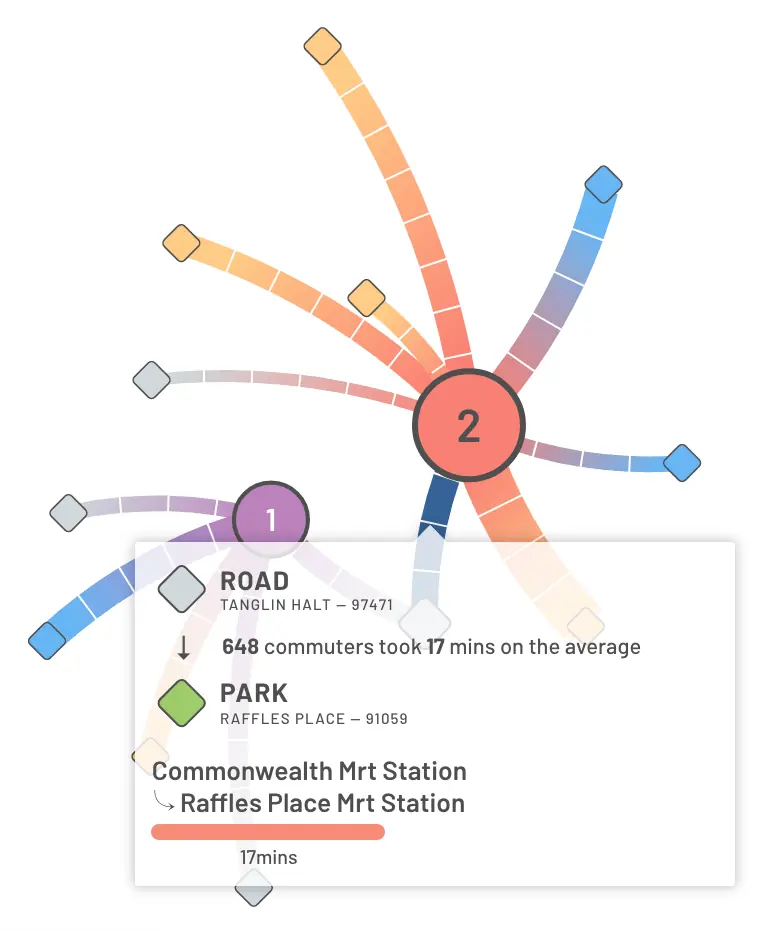
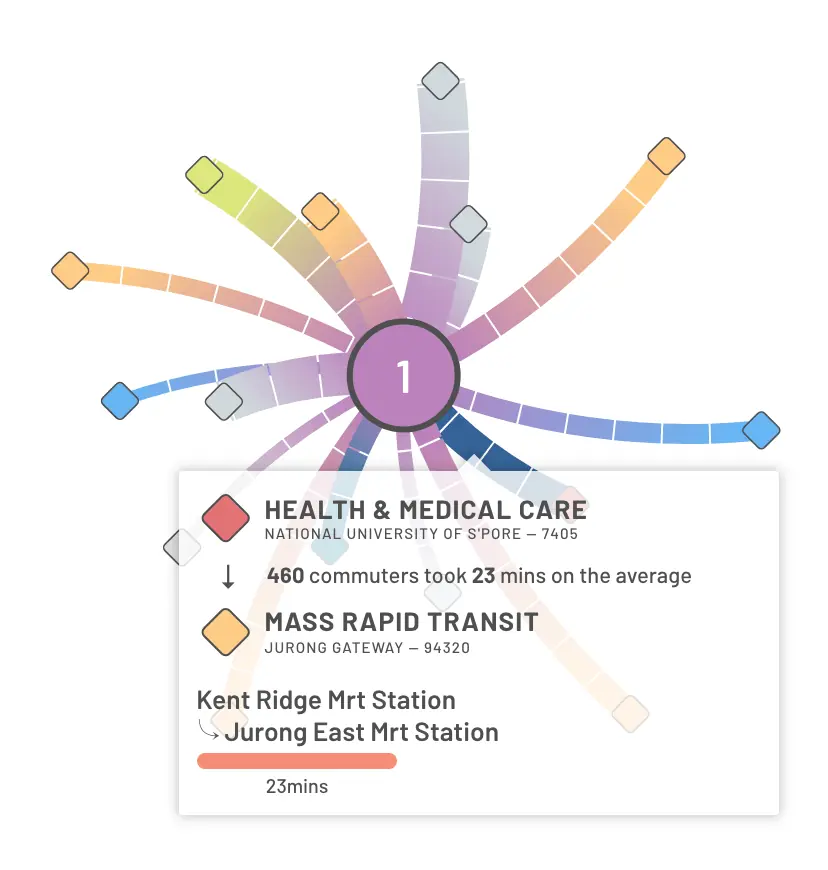
Graph to show route choices (1). Thickness and length of links are proportional to the number of commuters and duration of the route, respectively.
Graph to show route choices (2)
Graph to show route choices (3)
Linking the map and chart
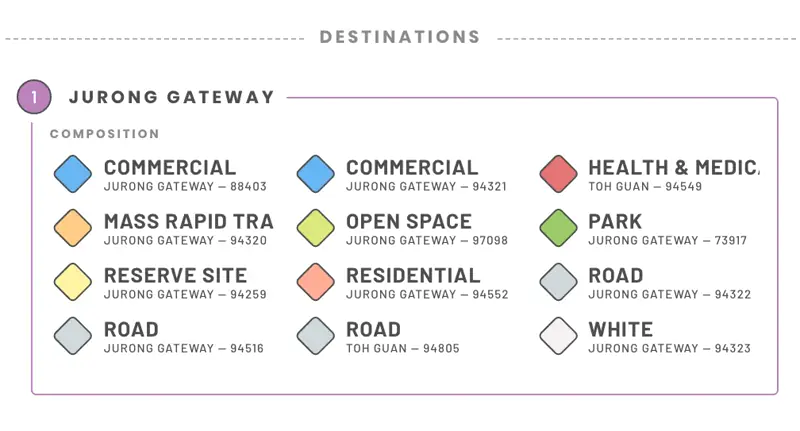
Example of land use composition
Time manager for navigation
Patterns of 7 similar neighbourhoods
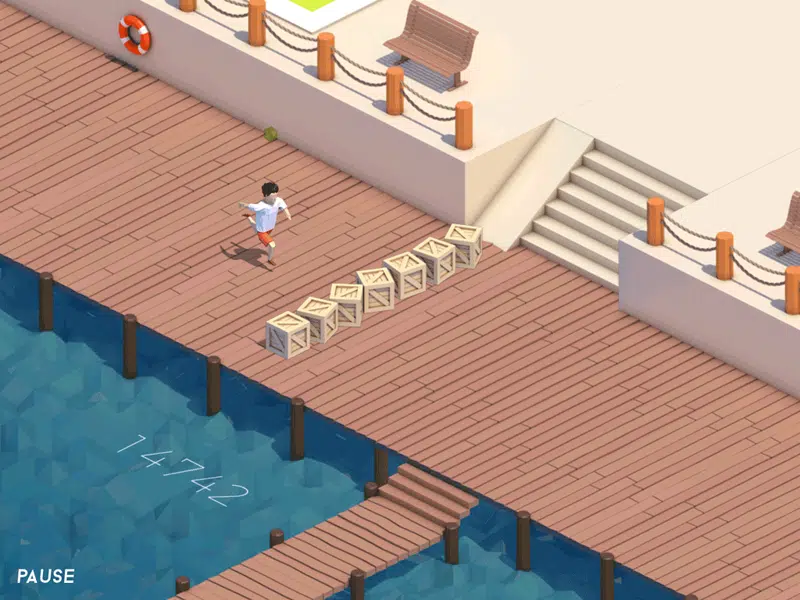
Courir
Early 2016
A multiplayer endless-running iOS game where players compete against each other in real-time.
Play against your friends in a real-time test of agility, speed and concentration or generate obstacles to try to wipe your friends out in special multiplayer mode.
Built using Swift, Cinema4D.
ExploreMain game screen
Single player mode
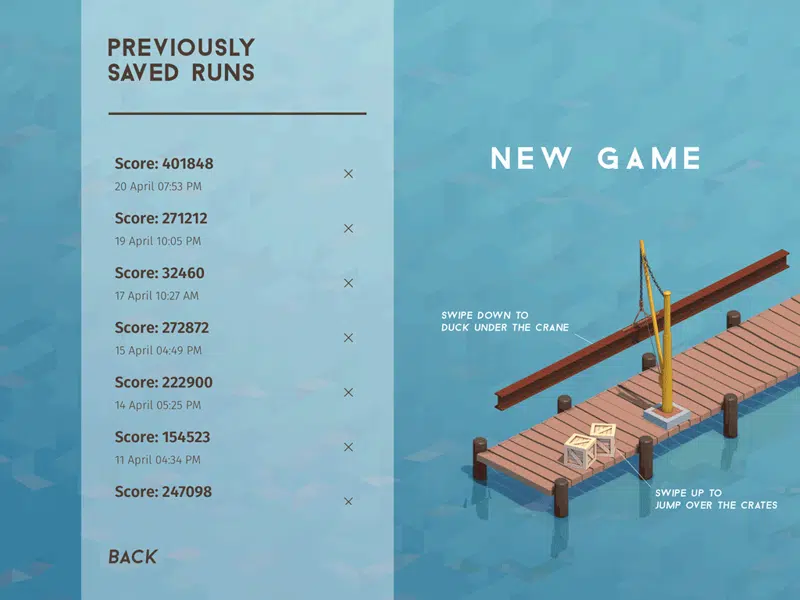
Duck under cranes

Jump over crates
Player movements

ducking
running
jumping
Environment

Icon
Promo